
The purpose of this post is not to question the value of properly designed, administered, and utilized Employee Engagement Surveys. They indeed provide a platform for employees to voice their opinions and concerns, help management make informed decisions based on collective employee feedback, and pinpoint areas where the company excels and where it needs improvement. Employee Engagement Surveys can be used either regularly and/or during crucial moments within a company’s lifecycle, e.g., after a policy or an organizational change. Formats also vary, from the short and frequent ‘pulse check’ to the lengthier quarterly or biannual survey.
In the current era marked by the ‘Great Resignation’ and ‘Quiet Quitting’, Employee Engagement Surveys are too often perceived as miracle solution providers. The prevailing sentiment seems to be, “Administer an Employee Engagement Survey to ‘listen to your employees’ and find ways to retain them at minimal cost.” And yet, there are many ways these surveys can turn useless or even counterproductive.
To reason logically, we could deconstruct the decision paths underpinning Employee Engagement Surveys as follows: each employee observes his or her work environment, compares it (consciously or not) with his or her expectations (‘it is better/worse than I expected’). However, humans are not machines: the assessment of this gap between expectations and reality is subject to cognitive biases (which we will get back to later). Ultimately, to be recorded and analyzed, the employee needs to participate and, by doing so, may alter his or her answers to sound more positive or negative than their true feelings.
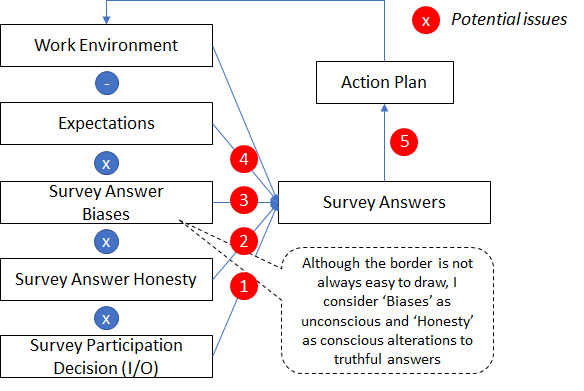
The theoretical build faces many limitations, highlighted by red circles. To understand them, we need to put ourselves in the employee’s shoes.
Let’s consider, first, the ‘Survey Participation Decision’ (bubble 1). The employee is, consciously or not, acting rationally, in his or her own self-interest, and considers whether answering the survey brings more net benefit (when considering cost) than not answering. The expected benefit (and the Employee Engagement Survey’s main purpose) is, as we wrote earlier, an improvement in the Work Environment. The costs include (i) the time spent on answering the Employee Engagement Survey, (ii) the work required as a follow-up to design the action plan, and, in some environments, (iii) the fear of retaliation in case the employee provides negative comments. Employees believing that no action will be taken as a follow-up, or that the survey may bring more harm than good, may decide not to answer altogether. These employees are typically more disengaged than the average. Therefore, unless the participation rate is high, we may assume that Employee Engagement Survey results tend to exhibit a slight positive bias – i.e., the results might paint a rosier picture than the reality. If the employee decides, after all, to answer, he or she may also consciously ‘pump up’ his or her answers to be ‘left in peace’ and/or avoid retaliation, especially if he or she believes that the promised anonymity is fictitious (bubble 2).
Biases in Employee Engagement Surveys (bubble 3) are well documented. For a broader discussion on behavioral biases, I strongly recommend reading Daniel Kahneman’s “Thinking, Fast and Slow”. To name a few in this particular context:
- The social desirability bias, by which an employee will answer in a way that makes him or her ‘look good’
- The acquiescence bias, by which questions are formulated in a way that influences answers.
- The question order bias, by which earlier answers influence (positively or negatively) subsequent ones.
- The extreme response bias, by which a disengaged employee will mark the same answer for each question to complete the survey as quickly as possible – this is a ‘borderline’ case between bias and honesty.
Often overlooked is the role and impact of expectations in shaping employees’ answers, which may ultimately lead to counterproductive conclusions and actions (bubble 4). High-performing, highly engaged, and highly motivated employees expect their employer (and, ultimately, their manager) to provide them with opportunities to express and develop their talents. If this is not the case, they may be prone to quickly ‘Quiet Quit’ or even leave the company. On the other hand, a team of ‘B players’ will content itself with average work conditions and may prioritize job safety over development and challenge, thus answering more favorably to the Employee Engagement Survey. Paradoxically, all conditions being equal, the manager who hired the ‘A team’ will get lower scores than the manager of the ‘B team’. This can become problematic when Employee Engagement Survey results are tied to decisions such as bonuses or progression. In that case, other data points are required to shed more light on the situation; otherwise, the action plan resulting from the Employee Engagement Survey analysis will miss the target (bubble.
Finally, the answers themselves should be looked at carefully (bubble 5). From my own experience, two vivid considerations immediately come to mind. First, results are often reported as team or group averages. These statistical metrics are a convenient way to convey trends, but they should always be considered in conjunction with distributions. Indeed, a team reporting engagement scores of 10, 10, 0, and 0 probably faces different challenges compared with another one with ratings of 5 altogether (although the average rating is 5 in both instances). Second, qualitative comments, when analyzed, can trigger ‘halo biases’. Because only a minority of employees tends to provide well-constructed comments (partly due to the implicit cost-benefit analysis discussed earlier), the few impactful comments will tend to have a disproportionate impact in the decision-maker’s mind, although they only represent the voice of one person. ‘Quantifying the qualitative’ is thus another imperative.
In conclusion, I have aimed at showing in this post that Employee Engagement Surveys are not the magic wand that many see in them. They do provide good indications of the direction in which things are going, but they are not the all-in-one toolbox. Passive monitoring tools such as those offered by Microsoft (which I discussed a few weeks ago) provide deeper insights into the behavior of employees and group dynamics. However, traditional metrics like the rate of voluntary and involuntary turnover remain strong (although lagging) indicators of a potential issue. Frequent interactions between employees and managers, combined with strong feedback processes and adequate manager training, may also go a long way. However, the effectiveness of all those ‘tools’, including Employee Engagement Surveys, is based largely on the positive culture that the company promotes, a culture where transparency and openness to feedback are prized, starting from the very top of the organization. Only with such a foundation can an organization truly know its strengths and weaknesses.